Looker Studio and GA4: How to Create a “Conversions per Landing Page” Report

Creating a Looker Studio report that shows number of conversions per landing page is surprisingly counterintuitive, but these steps will get you there.
If you’re looking to create a Looker Studio (formerly Google Data Studio) chart that shows which GA4 session_start events (what UA would called “entry pages”) resulted in a conversion, you’ll need to use the “blended data” feature in Looker Studio and join two different data tables. Let’s take a look at the steps:
Step 1: Enable “session_id” as a custom definition in Google Analytics 4.
1. Navigate to the “admin” section at the bottom-left of your GA4 dashboard
2. Click “Custom Definitions
3. Click “Create Custom Definition”
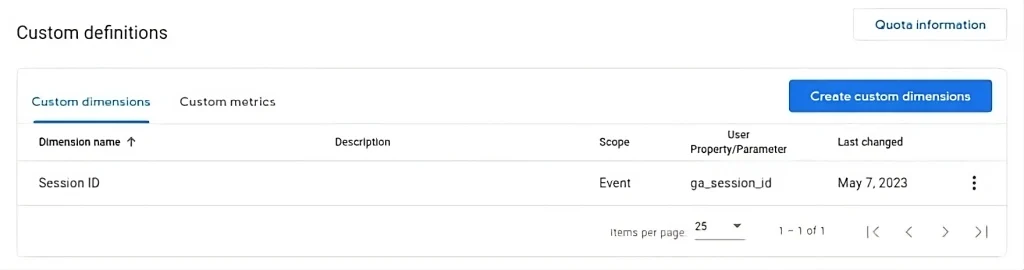
4. Name the dimension “Session ID”
5. Choose “ga_session_id” as the Event parameter
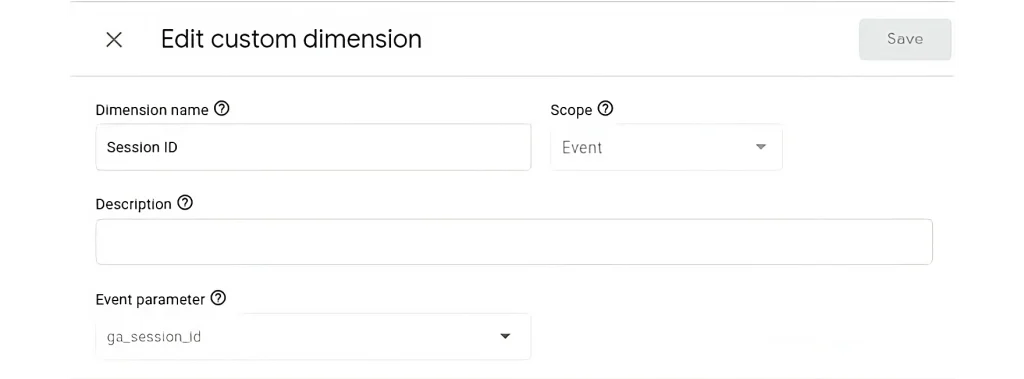
6. Click “save”
You’ve just exposed session_id as a reportable dimension in GA4, and it will propagate to Looker Studio. However, there are a few important points:
- The ga_session_id is not available retroactively; you’ll only be able to accurately report on conversions that happened after you enabled this custom dimension.
- It may take up to 24 hours before you start seeing Session ID as an option in Looker Studio.
- After 24 hours, I still couldn’t see it, so I created a new data source in Looker studio for GA4 (even though I already had one), and the Session ID was available in the new data source.
Step 2: Add your Chart to Looker Studio and Create a Blend
1. In the “data source” for your new chart, select your Google Analytics 4 connector and then click “Blend Data”
2. Under “Table 1”, add “Session ID” and “Event Name as Dimensions
3. Under “Table 1”, add “Conversions” as a metric
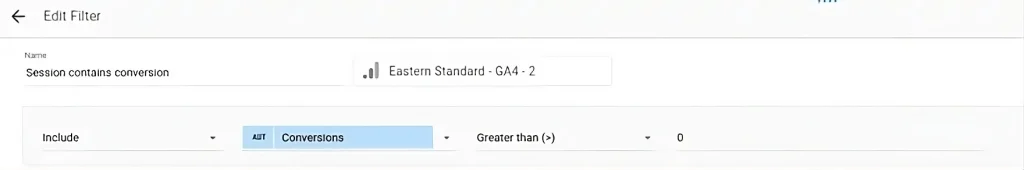
4. Under “Table 1”, add a filter called “Session contains conversion” that includes Conversions > 0
5. Click “Join another table” and choose the same Google Analytics 4 connector – you’re joining two tables from the same data source.
6. Add “Session ID” as a dimension to Table 2
7. Click “Configure Join” and ensure the join is set to “Inner” and that the join field is “Session ID”
8. Add “Page Path” and “Event Name” as dimensions to Table 2
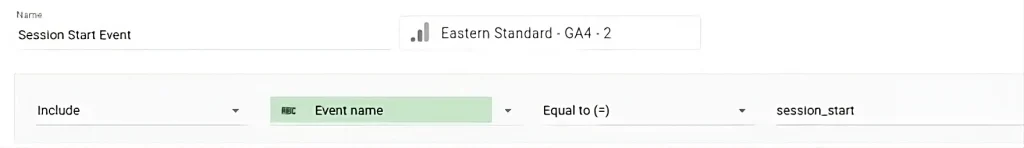
9. Create a filter called “Session Start Event” that looks for event name equal to “session_start”
10. Click “Save”
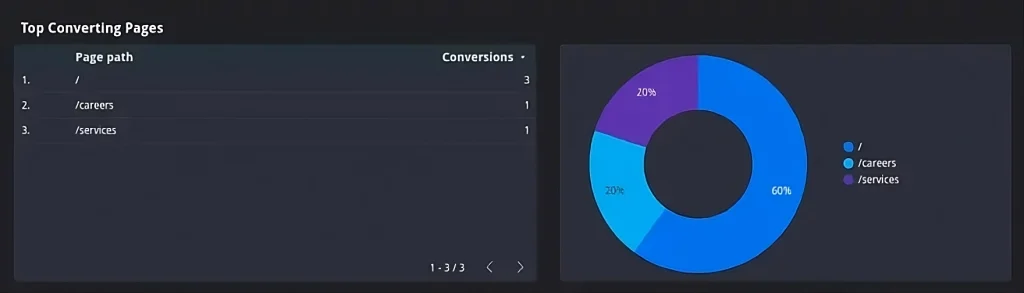
Step 3: Configure your Charts
1. Set the dimension for your chart to “Page path”
2. Set the metric to “Conversions”
You should be all set to start collecting conversion data based on entrance pages!
Q&A
Why is creating a conversions per landing page report in GA4 complicated?
GA4 doesn’t natively connect session_start events (entry pages) to conversions the way Universal Analytics did. You need to use Looker Studio’s blended data feature to join two different data tables together, matching sessions that had conversions to their original landing pages.
How do you enable Session ID as a reportable dimension in GA4?
Navigate to Admin, then Custom Definitions, and create a new custom dimension named Session ID with ga_session_id as the Event parameter. Note that this data is not available retroactively; you can only report on conversions that happen after enabling the custom dimension.
Why can't I see Session ID in Looker Studio after enabling it in GA4?
It may take up to 24 hours before Session ID appears as an option in Looker Studio. If it still doesn’t appear after 24 hours, try creating a new data source in Looker Studio for GA4 even if you already have one. The Session ID should be available in the new data source.
How do you configure the blended data join in Looker Studio?
Join two tables from the same GA4 data source. Table 1 needs Session ID and Event Name as dimensions with Conversions as a metric, filtered to sessions with conversions greater than zero. Table 2 needs Session ID, Page Path, and Event Name, filtered to session_start events. Use an inner join on Session ID.
Eastern Standard helps organizations make data-driven decisions with robust analytics. Our digital strategy team implements measurement frameworks that drive results. Contact us about your analytics needs.